Home AI Technology Gaming Future Automobile Geography Top 10 Trending How To Discover
---Advertisement---

Mapped: The Global Energy Mix

Macro Discovery
On: August 7, 2026 7:28 AM
Follow Us:
---Advertisement---
The Global Energy Mix
The Global Energy Mix , The Global Energy Mix — Renewables, Coal & CO2 Data , global energy mix renewables vs fossil fuels statistics , what percentage of global electricity comes from renewable energy , how much has solar energy cost fallen since 2010 statistics , how much clean energy was added globally in 2025 record , is CO2 still rising despite renewable energy growth , which country uses the most coal in the world , What percentage of global electricity comes from renewables? , How much has solar energy cost fallen? , How much clean energy was added globally in 2025? , re CO2 emissions from energy still rising? , hich country uses the most coal? ,
Mapped: The Global Energy Mix — MacroDiscovery
MacroDiscovery
Energy & Climate · 5 min read · IEA Global Energy Review 2026 · Primary
IEA Global Energy Review 2025 + 2026 (Primary · iea.org) · IRENA Renewable Costs 2024
Energy Transition & Climate

Mapped: The Global
Energy Mix

The world added 800 gigawatts of clean energy in 2025 — a new record. Renewables and nuclear now supply 40% of global electricity. Solar electricity costs fell 90% in 14 years. And yet CO2 emissions are still rising, just more slowly. This is the energy transition — happening fast, but not yet fast enough.

By MacroDiscovery
Source: IEA Global Energy Review 2026 · IEA GER 2025 (primary, directly fetched) · IRENA
Latest data: Full-year 2025
800 GW
renewable capacity added in 2025 · new world record · IEA primary
40%
of global electricity from renewables + nuclear · for the first time ever · 2024
−90%
fall in solar electricity cost since 2010 · now cheapest in history · IRENA primary
+0.4%
CO2 growth in 2025 — slowing but still rising · IEA primary 2026
Visualization 01 — Global Electricity Mix
Where the World’s Electricity Comes From

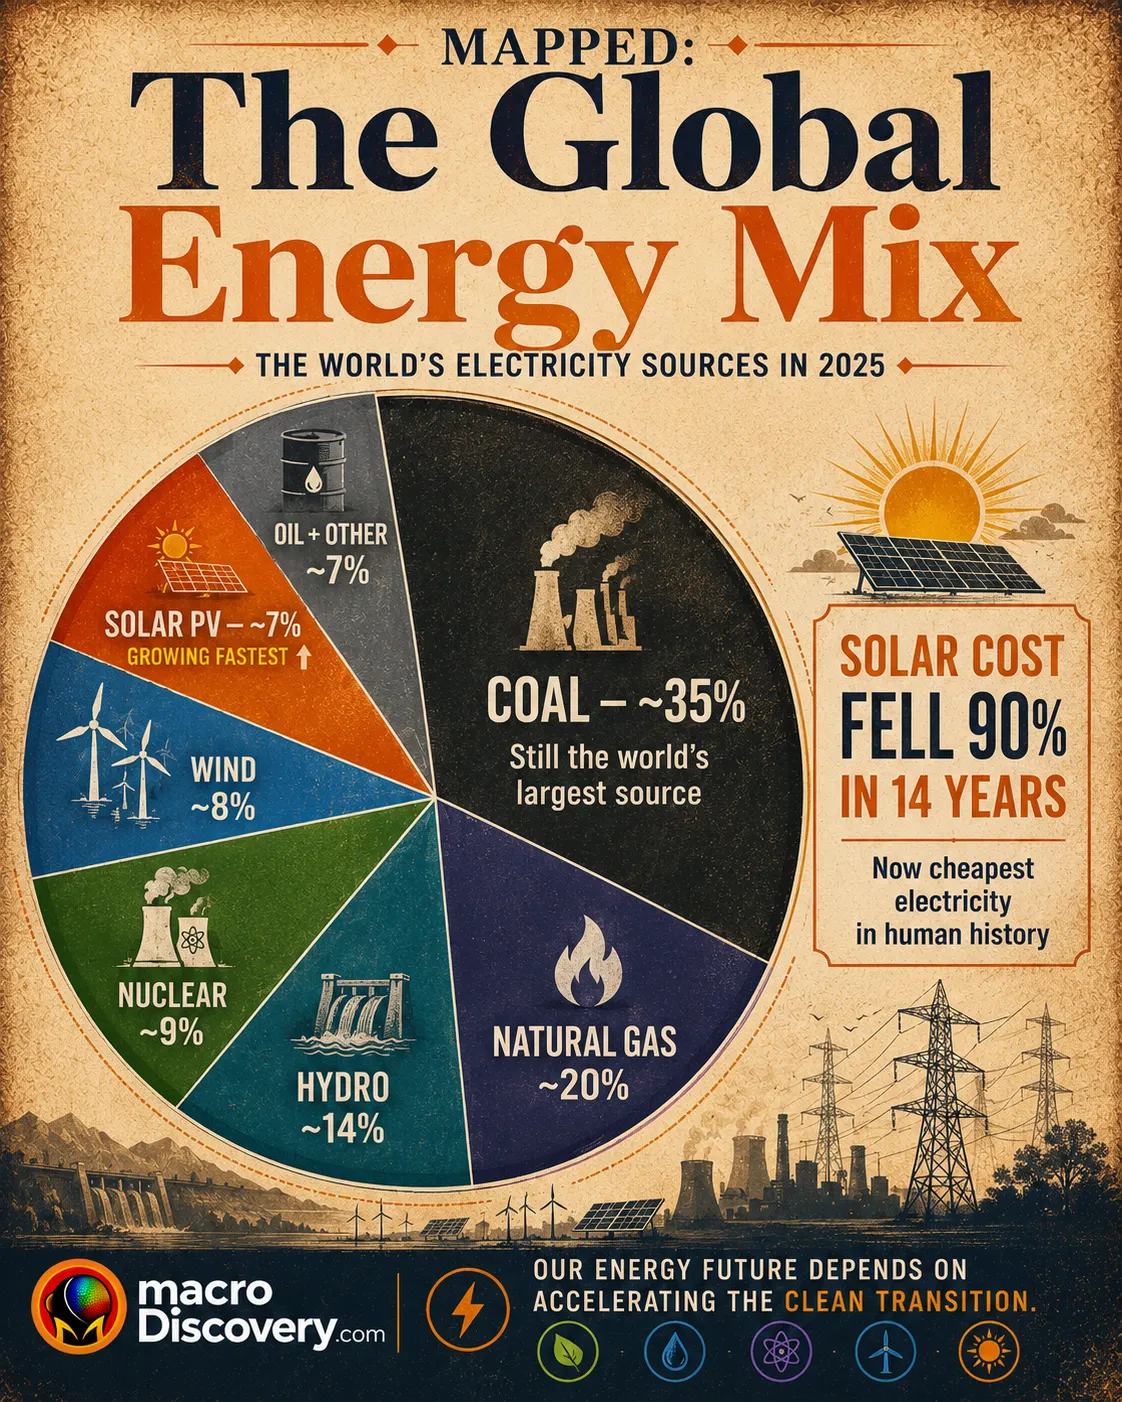
Share of global electricity generation by source, 2024. Bars are scaled relative to coal. Source: IEA Global Energy Review 2025 (primary, directly fetched from iea.org) · IEA Breakthrough Agenda Report 2025 (LCOE data).

Fossil fuel — declining share
Clean — established
Clean — growing
Clean — fastest growth
⚫ CoalLargest source
Still the world’s single biggest electricity source · China accounts for 58% of all global coal use · 2025: renewables now virtually match coal’s global generation total · LCOE: ~$0.10–0.18/kWh
~35% of gen
🔵 Natural Gas2nd largest
Demand grew 2.7% in 2024 — strongest growth of any fossil fuel · often used as “transition fuel” between coal and renewables
~20% of gen
💧 HydropowerClean · Stable
World’s oldest renewable · rose in 2024 due to above-average rainfall globally · LCOE: $0.057/kWh · climate-sensitive (drought = less power)
~14% of gen
⚛️ NuclearClean · Growing
7 GW new capacity online in 2024 (+33% vs 2023) · generation +100 TWh · France + Japan restarted plants · 12 GW construction started in 2025
~9% of gen
💨 Wind PowerFast growth
+670 TWh from wind + solar combined (record) in 2024 · US: wind + solar = 16% (first time passed coal) · LCOE: $0.034/kWh — cheapest new power source on earth
~8% of gen
☀️ Solar PVFastest growth
~560 GW solar added in 2024 alone (~80% of all new renewables) · cost fell 90% since 2010 · LCOE: $0.043/kWh · 91% of new renewables now cheaper than cheapest fossil fuel
~7% of gen
🛢️ Oil (electricity)Minimal
Oil’s share of total energy demand fell below 30% for the first time ever (was 46% at peak) · used for electricity mainly in Middle East and island economies
<3% of gen
2024 milestone: Renewables (32%) + Nuclear (9%) = 40% of global electricity for the first time in history. The remaining 60% still comes from fossil fuels. Source: IEA Global Energy Review 2025 (primary, directly fetched).
Visualization 02 — The Energy Transition Timeline
Five Years That Changed Energy Forever

The speed of the solar revolution has no precedent in energy history. Here is how fast things moved — and where they stand today. Source: IEA Global Energy Review 2025 + 2026 (primary) · IRENA Renewable Power Costs 2024.

2015
Paris
Paris Agreement — The World Commits. Renewables Still Expensive.
196 countries agreed to limit warming. Renewables were growing but still far from mainstream. Solar cost had already started falling fast. Most of the world still expected fossil fuels to dominate for decades.
Fossils ~85% of energySolar cost falling fast
2020–2022
Shift
IEA Calls Solar “Cheapest Electricity in History” — The Market Turns
IEA declared solar PV the cheapest source of new electricity ever seen. Russia’s invasion of Ukraine (2022) triggered an energy crisis that accelerated Europe’s renewable push dramatically. Renewables suddenly looked not just clean — but strategic.
IEA: solar cheapest everUkraine war: energy crisisEU solar surge begins
2024
Records
700 GW Added · EU: Solar+Wind Beats Coal+Gas · US: Renewables Pass Coal
700 GW of renewable capacity added globally — the 22nd consecutive annual record. In the EU, solar and wind surpassed the combined share of coal and gas in electricity generation for the first time. In the US, solar and wind’s share overtook coal. In China, they reached nearly 20%.
700 GW added (22nd record)EU: wind+solar > coal+gasUS: wind+solar > coal
2025
New record
800 GW Added · Renewables Virtually Match Coal · EU Passes All Fossils
Global renewable capacity additions hit 800 GW — a new world record. 75% was solar. Renewables now generate almost as much electricity globally as coal. In the EU, solar and wind reached 30% — surpassing all fossil fuels combined for the first time. Battery storage added 110 GW (+40%).
800 GW added (new record)EU: renewables > all fossilsBattery: 110 GW added
Problem
The catch
CO2 Still Rising — Because Energy Demand Is Growing Even Faster
Even with record renewable additions, CO2 emissions still grew by 0.4% in 2025. Why? Global electricity demand grew 4.3% in 2024 — driven by AI data centres, EVs, and extreme heat. Renewables are growing fast. But demand is growing faster. The two lines haven’t crossed yet.
CO2: +0.4% in 2025Electricity demand: +4.3%Data centres: +20% capacity

The global energy transition is real. It’s happening faster than almost anyone predicted 10 years ago. Solar costs fell 90% in 14 years. 800 gigawatts of clean energy were added in 2025. And CO2 emissions are still rising. Both things are true at the same time. That is the central story of energy in 2025.

IEA Primary · Latest 2025 Data
800 GW
800 gigawatts of renewable capacity were added globally in 2025 — a new world record for the 23rd consecutive year.
75% of that was solar PV. Battery storage grew 40% in 2025 to reach 110 GW of new additions — more than the highest-ever annual additions from natural gas. The world is now adding more clean energy every year than it added in total before 2010.
Source: IEA Global Energy Review 2026 (primary · iea.org) · covers full-year 2025 data

“Solar is now the cheapest source of electricity in recorded human history. The problem isn’t the price of clean energy. It’s the speed of transition.”

Solar Costs Fell 90% in 14 Years — Nothing in Energy History Matches This

Onshore wind electricity now costs $0.034 per kilowatt-hour. Solar PV costs $0.043. These are the cheapest prices ever recorded for new electricity generation in human history (IEA Breakthrough Agenda 2025, IRENA 2024). In 2010, solar was far more expensive than coal. By 2024, 91% of new renewable projects were cheaper than the cheapest fossil fuel alternative. The cost revolution happened in 14 years. It is still accelerating.

Why it matters: when clean energy is also the cheapest energy, the argument for fossil fuels becomes purely political — not economic.
IEA GER 2025 · Direct Fetch
40%
Renewables and nuclear together supplied 40% of global electricity in 2024 — for the first time in history.
Renewables alone reached 32%. Nuclear added 9%. That 40% milestone is significant. The EU went further in 2025 — solar and wind alone reached 30%, surpassing all fossil fuels combined. The US saw wind and solar overtake coal for the first time. China reached nearly 20% from wind and solar.
Source: IEA Global Energy Review 2025 (primary · directly fetched from iea.org · “contributed 40% of total generation for the first time”)

China: The World’s Biggest Clean Energy Builder — and Biggest Coal Burner

China is simultaneously the world’s largest renewable energy builder and its largest coal consumer. China accounted for 58% of all global coal use in 2024 — a new record. It also installs more solar and wind than the rest of the world combined. China’s solar electricity cost is just $0.033 per kilowatt-hour — the cheapest anywhere. The same country is driving both the clean energy boom and the coal problem. There is no simple narrative here.

Why it matters: the world’s energy future will largely be determined by decisions made in Beijing — not Brussels or Washington.
The Central Paradox · IEA Primary
+0.4%
CO2 emissions still grew by 0.4% in 2025 — even with record renewable additions. Demand is growing faster than clean energy can replace.
Global electricity demand grew 4.3% in 2024 — twice the 10-year average. AI data centres, electric vehicles, and extreme heat all drove consumption higher. Renewables are winning the supply battle. But demand is growing so fast that fossil fuels are still needed to fill the gap. Clean energy is limiting CO2 growth — but not yet reversing it. The good news: clean energy since 2019 now avoids 2.6 billion tonnes of CO2 every year.
Source: IEA Global Energy Review 2025 + 2026 (primary · iea.org) · “emissions growth slowed to 0.8% in 2024, 0.4% in 2025” · “deployment since 2019 prevents 2.6 Gt CO2 annually”

Where It Goes From Here

The IEA’s Electricity 2026 report projects that power sector CO2 emissions will plateau through 2026–2030 as renewables and nuclear take growing shares. The CO2 intensity of electricity already fell 3% in 2024 — a record. At that pace, electricity becomes the cleanest part of the global economy within this decade. The harder problem is heating, transport, and heavy industry — sectors where electrification is slower and fossil fuels still dominate.

Why it matters: the electricity transition is largely solved economically — the question is whether it happens fast enough to matter for the climate.
Key Numbers at a Glance
Energy · Record Capacity
800 GW
Renewable capacity added in 2025 — a new world record. 75% was solar PV. 23rd consecutive year of new records.
IEA Global Energy Review 2026 (primary)
Energy · Clean Milestone
40%
Renewables + nuclear hit 40% of global electricity in 2024 — for the first time ever in history.
IEA Global Energy Review 2025 (primary, directly fetched)
Energy · Solar Cost
−90%
Solar electricity cost fell 90% from 2010 to 2024. Onshore wind ($0.034/kWh) is now the cheapest new power source on earth.
IRENA Renewable Power Costs 2024 · IEA Breakthrough Agenda 2025
Energy · The Challenge
58%
China’s share of global coal use in 2024 — a new record. The same country installs more solar and wind than the rest of the world combined.
IEA Global Energy Review 2025 (primary, directly fetched)
Frequently Asked Questions
What percentage of global electricity comes from renewables?
Renewables supplied 32% of global electricity in 2024, rising further in 2025. Combined with nuclear (9%), clean sources hit 40% of global electricity for the first time ever in 2024. Coal remains the single largest source at around 35%. Source: IEA Global Energy Review 2025 (primary, directly fetched).
How much has solar energy cost fallen?
90% since 2010. Solar PV now costs $0.043 per kilowatt-hour globally. Onshore wind is even cheaper at $0.034/kWh — making it the cheapest new source of electricity ever recorded. 91% of new renewable projects in 2024 were cheaper than the cheapest fossil fuel alternative. Source: IRENA 2024 · IEA Breakthrough Agenda 2025.
How much clean energy was added globally in 2025?
800 gigawatts — a new world record and the 23rd consecutive year of record renewable additions. 75% was solar PV. Battery storage added 110 GW in 2025, up 40% from 2024 — more than the highest-ever single-year additions from natural gas. Source: IEA Global Energy Review 2026 (primary).
Are CO2 emissions from energy still rising?
Yes — but slowing fast. CO2 grew 0.8% in 2024 and slowed to 0.4% in 2025. Clean energy deployed since 2019 now avoids 2.6 billion tonnes of CO2 every year. Power sector emissions plateaued in 2025 and are forecast to stay flat through 2030 as renewables grow. Source: IEA Global Energy Review 2025 + 2026 (primary).
Which country uses the most coal?
China — accounting for 58% of all global coal use in 2024, a new record. China consumed more coal than the rest of the world combined. Paradoxically, China also installs more solar and wind energy than any other country, adding the majority of global new renewable capacity every year. Source: IEA Global Energy Review 2025 (primary).
Sources
  • IEA — Global Energy Review 2025: Key Findings (primary · directly fetched from iea.org · covers 2024 full-year data · “renewables + nuclear = 40% of generation for first time” · “700 GW added in 2024, 22nd consecutive record” · “solar+wind +670 TWh” · “EU: solar+wind > coal+gas first time” · “US: 16% wind+solar > coal” · “China: 58% global coal” · “CO2 +0.8% in 2024” · “2.6 Gt CO2 avoided since 2019”)
  • IEA — Global Energy Review 2026: Key Findings (primary · iea.org · covers 2025 full-year data · “800 GW renewable added in 2025” · “75% solar” · “renewables virtually match coal” · “EU wind+solar = 30% in 2025, surpassed fossil fuels” · “battery storage 110 GW +40%” · “CO2 +0.4% in 2025” · “12 GW nuclear construction starts” · “35 EJ fossil demand avoided”)
  • IEA — Breakthrough Agenda Report 2025: Power (primary · iea.org · “onshore wind LCOE $0.034/kWh · solar PV $0.043/kWh · hydropower $0.057/kWh · renewables most cost-competitive option for new electricity generation in 2024”)
  • IEA — Electricity 2026: Executive Summary (primary · iea.org · 4 days ago · “power sector emissions plateaued in 2025 · forecast flat 2026–2030 · 13,900 Mt CO2 from electricity annually · CO2 intensity −14% vs decade ago”)
  • IRENA — Renewable Power Generation Costs 2024 (primary · irena.org · July 2025 · solar cost fell 90% from 2010–2024 · battery storage −93% · 91% of new renewables cheaper than cheapest fossil in 2024)
Macro Discovery

Sukh Dhaliwal

Sukh Dhaliwal is the founder of Macro Discovery, an independent digital publication covering AI, technology, science, future trends, and global innovation through visual storytelling and data-driven analysis.

Join WhatsApp

Join Now

Join Facebook

Follow us

Leave a Comment