Frontier Technology Leadership
The map of frontier technology leadership. One country holds the field.
The readiness map and the patent map are different. The United States leads readiness. China is outside that top 10, and close to even on patents.
Three numbers
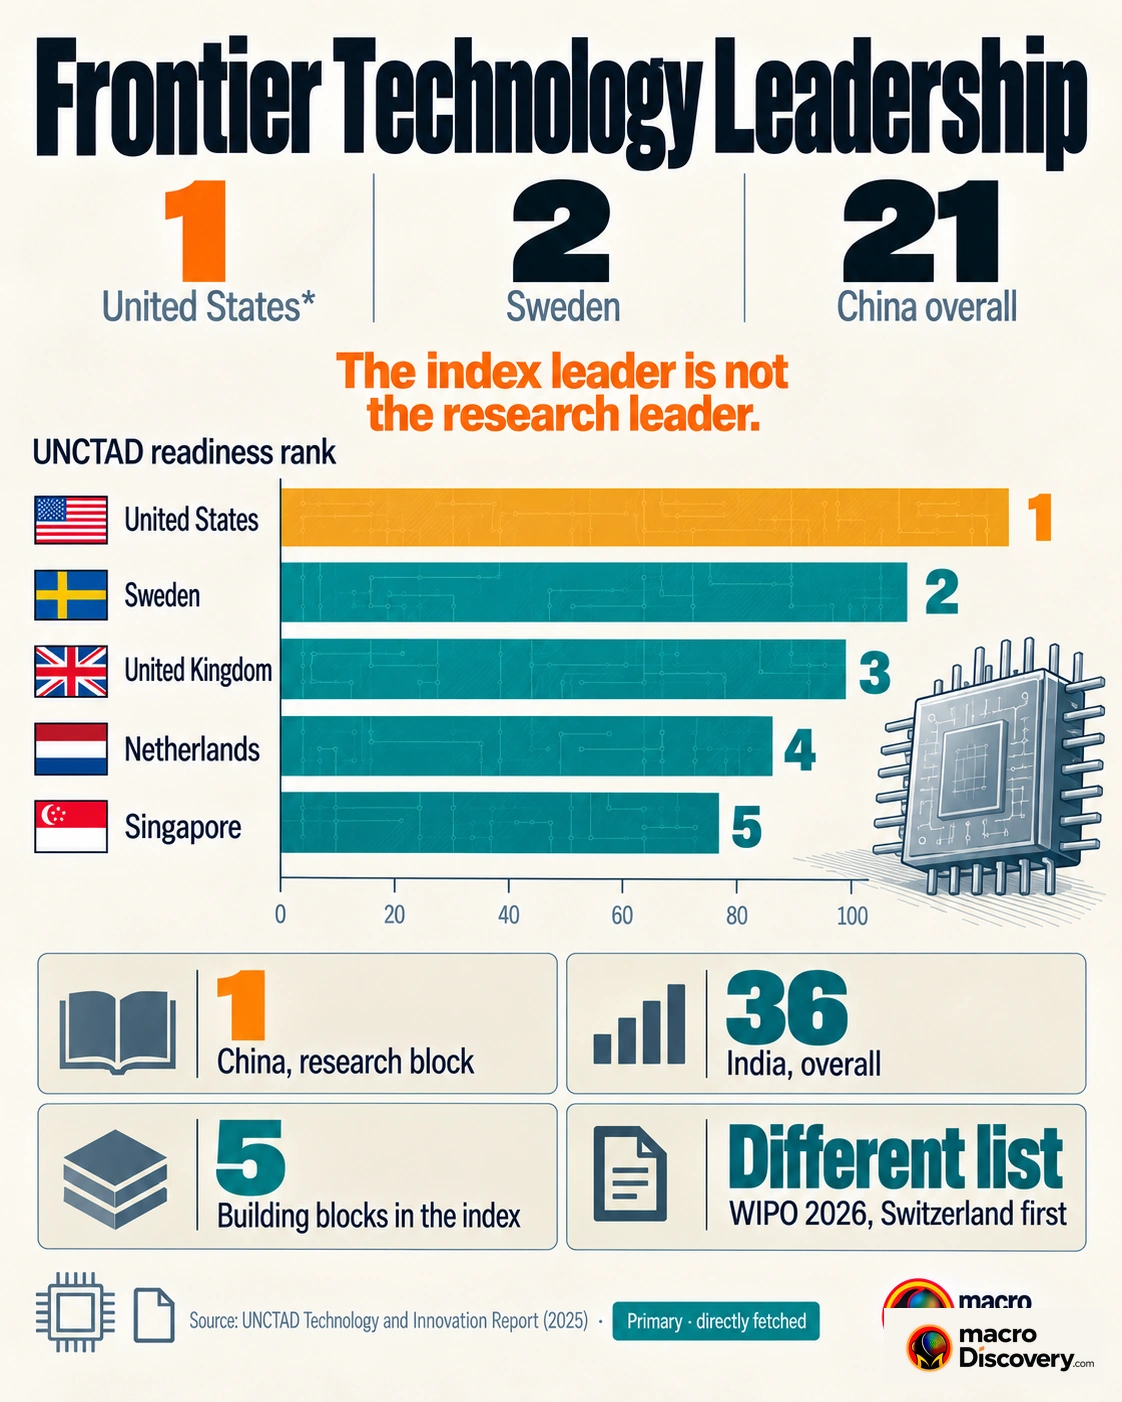
- 1st — United States on UNCTAD’s frontier-technology readiness index. Sweden is 2nd. The United Kingdom is 3rd. Source: UNCTAD, 2024 list.
- Outside the top 10 — China on that readiness list. Korea is 7th. France is 10th. Source: UNCTAD.
- 11, 10, and 4 — patent-field leads in 2025 for the United States, China, and Japan, across 25 tracked technologies. Source: technology monitor.
What the data shows
A common claim is that a map of frontier-technology leadership shows one country holding the field. The fact is that the readiness map and the patent map do not match. UNCTAD’s frontier-technology readiness index scores the capacity to use, adopt, and adapt technologies such as artificial intelligence and the internet of things. It uses five blocks: information and communication technology, skills, research and development, industry activity, and access to finance. A 2024 top ten runs United States, Sweden, United Kingdom, Netherlands, Singapore, Switzerland, South Korea, Germany, Ireland, France. China is not on it. The map of readiness is a rich-country list, with two Asian economies in the ten. It is not a two-country race.
The patent map is the two-country race. A 2025 tracker of 25 strategic technologies put leadership at 11 fields for the United States, 10 for China, and 4 for Japan. China gained world patent share in all 25 fields that year. The United States lost share in all 25. The United States still led surgical robots, gene therapy, and precision medicine. China led smart grids, generative artificial intelligence, and lithium batteries. Japan still led extreme-ultraviolet lithography, solid-state batteries, electric vehicles, and fuel cells. Three fields flipped toward China in one year: robotics, lithium batteries, and satellites. A share of patents is not a readiness rank, and a readiness rank is not a factory.
The index itself says not to treat the score as a level. UNCTAD notes that a weighting update means absolute scores are not comparable across editions. Use the rank. A country can top the industry-activity block, where high-technology exports sit, and still miss the composite top ten. Bruegel’s 2025 paper on radical patents found US firms ahead in quantum computing and, by less, in artificial intelligence, with Chinese firms stronger in semiconductors and European firms behind in all three. That is a third cut. Adding the three maps into one leader double-counts different questions.
On the readiness list China is outside the top 10. This chart is patents only.
| Count | Figure | What it is |
|---|---|---|
| Readiness rank, US | 1st | UNCTAD index, 2024 list |
| Readiness, 2nd and 3rd | Sweden, UK | Not a US-China pair |
| China, readiness | outside top 10 | Korea is 7th |
| Patent leads, 2025 | 11, 10, 4 | US, China, Japan |
| Index blocks | 5 | ICT, skills, research, industry, finance |
How it was measured
The readiness index combines five blocks into one score. Internet use and download speed sit in the first block. Publications and patents sit in research. High-technology exports sit in industry. A weighting change means a higher score in a later edition is not a gain. UNCTAD says to compare ranks.
A patent-field lead is the largest world share in that technology in one year. Gaining share in all 25 fields is not the same as leading all 25. A firm-level count of radical patents, as in the Bruegel paper, can rank companies rather than countries. The three should not be averaged.
What it means
It is settled that the United States leads the UNCTAD readiness list, that China is outside that top 10, and that a 2025 patent tracker split 25 fields 11, 10, and 4. It is not settled that one map is leadership. Use 1st for readiness. Use 11 and 10 for the patent split. Use five for the blocks in the index. Do not treat a readiness rank as a factory count.
Common misreadings
- The readiness top ten is not a US-China map. China is outside it.
- A patent lead in 10 fields is not the readiness rank.
- Index scores are not comparable across editions. Use the rank.
Where the numbers come from
How we built this
- Dataset: UNCTAD frontier-technology readiness ranks; a 2025 tracker of 25 patent fields; Bruegel radical-patent paper.
- Scope: Readiness and patents kept apart. No single leader drawn from both.
- Figures: 1st is the US readiness rank. Outside the top 10 is China on that list. 11 and 10 are the patent split.