Home AI Technology Gaming Future Economy Geography Automobile Science Web Stories

Ranked: The Countries With the Highest Taxes

Macro Discovery
On: September 13, 2026 7:39 AM
Follow Us:
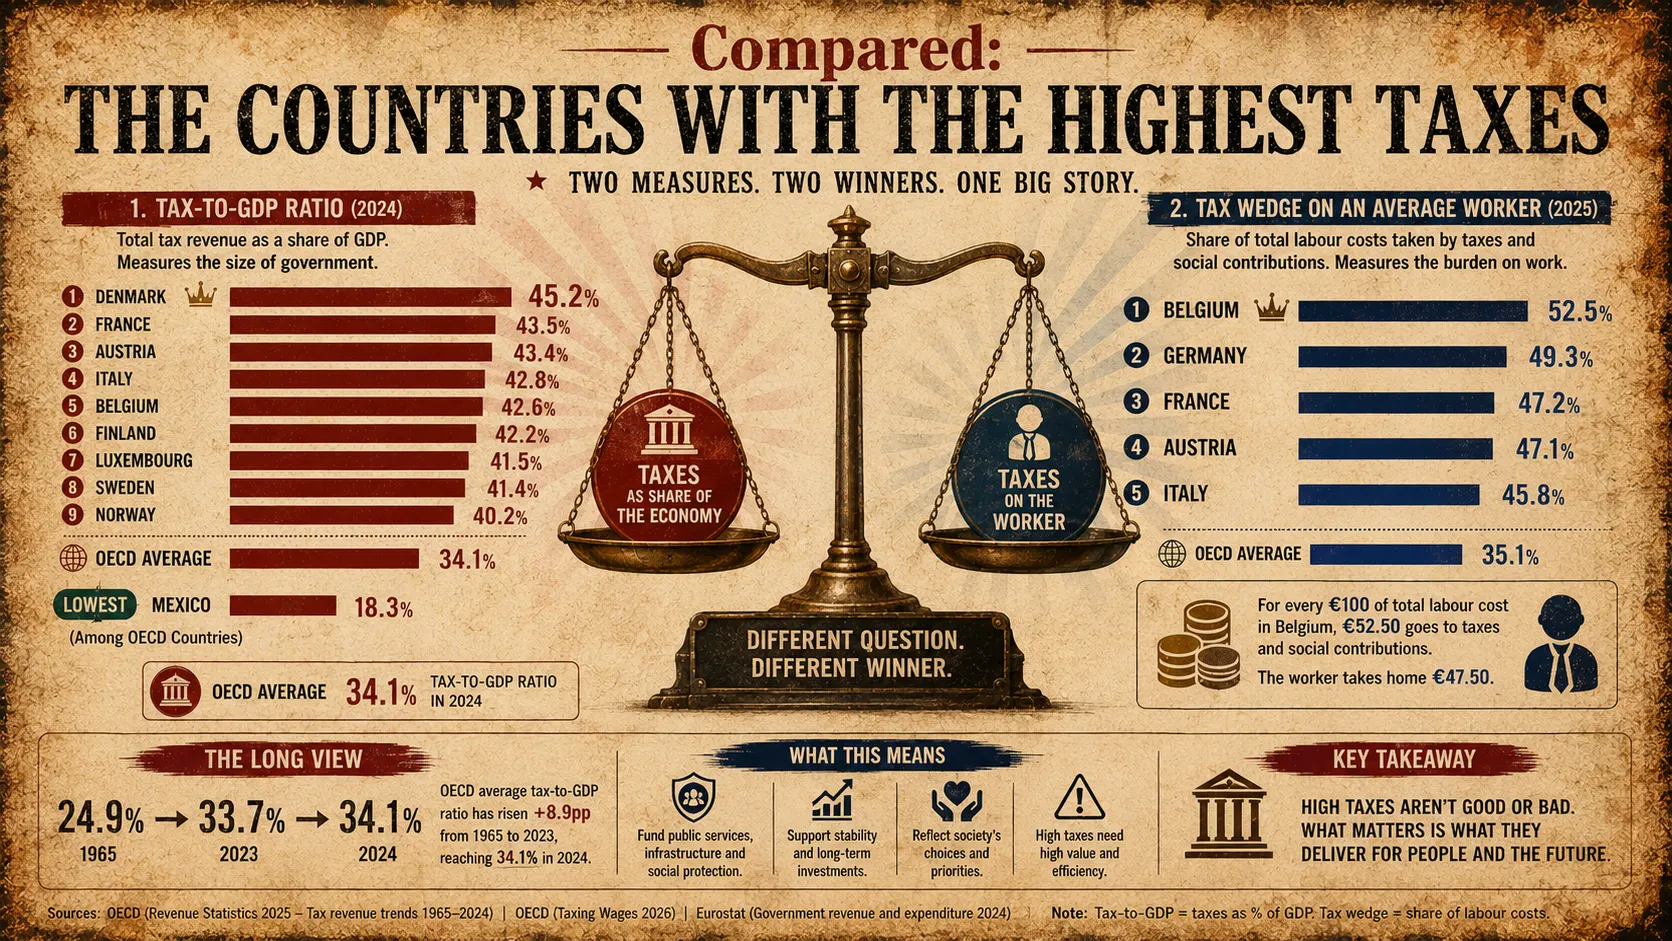
Editorial infographic comparing countries with the highest tax burdens, showing tax-to-GDP ratios for 2024 and tax wedges for an average worker in 2025, led by Denmark and Belgium respectively.
Compared: The Countries With the Highest Taxes — MacroDiscovery
MacroDiscovery
Tax Policy · Public Finance · 5 min read · OECD RS 2025 · Taxing Wages 2026 · Primary · Confirmed
OECD — Revenue Statistics 2025: Disentangling Personal Income Tax Revenue in OECD Countries (PRIMARY · oecd.org · doi.org/10.1787/3a264267-en · December 9, 2025 · OECD Publishing) · OECD — Taxing Wages 2025 (PRIMARY · oecd.org · doi.org/10.1787/b3a95829-en · April 30, 2025 · 2024 tax wedge data) · OECD — Taxing Wages 2026 (PRIMARY · oecd.org · April/May 2026 · 2025 data · FRESHEST AVAILABLE) · Eurostat — Tax Revenue Statistics (PRIMARY · ec.europa.eu · updated April 22, 2026 · 2024 final EU data)
Tax Policy · Public Finance · Cross-Country Comparison · 2024–2025 Data

Compared: The Countries
With the Highest Taxes

Denmark had the highest tax-to-GDP ratio in the OECD for the second consecutive year in 2024, at 45.2%. Tax burdens across OECD countries ranged from 18.3% in Mexico to that 45.2% peak. But for the average worker, the heaviest burden falls on Belgium: its tax wedge — the share of total labour costs taken by income taxes and social security contributions — reached 52.6% in 2024, the highest in the OECD. The OECD average has risen from 24.9% in 1965 to 34.1% today, and 2024 was the first annual increase since 2021.

By MacroDiscovery
Source: OECD Revenue Statistics 2025 (Dec 9, 2025) · OECD Taxing Wages 2025/2026 · Eurostat 2026 · all primary
Key stat: Denmark 45.2% (tax-to-GDP) · Belgium 52.6% (tax wedge on labour)
45.2%
Denmark tax-to-GDP ratio 2024 · #1 OECD · second consecutive year · France 43.5% (#2) · Austria 43.4% (#3) · OECD Revenue Statistics 2025 (primary)
52.6%
Belgium tax wedge 2024 · #1 OECD worker burden · Germany 47.9% · France 47.2% · Italy 47.1% · OECD Taxing Wages 2025 (primary)
34.1%
OECD average tax-to-GDP ratio 2024 · up from 33.7% in 2023 · first annual increase since 2021 · historical: 24.9% in 1965 · OECD RS 2025 (primary)
18.3%
Mexico tax-to-GDP ratio 2024 · lowest in OECD · range: 18.3% (Mexico) to 45.2% (Denmark) · 27pp gap between top and bottom · OECD RS 2025 (primary)
Visualization 01 — Tax-to-GDP Ratio by Country · OECD 2024 (Preliminary Data)
The 27-Point Gap — From Denmark’s 45.2% to Mexico’s 18.3%

Total taxes as a percentage of GDP. This includes income taxes, social security contributions, VAT and consumption taxes, and corporate taxes — everything the government collects. This is the broadest measure of a country’s overall tax burden. OECD definition: compulsory, unrequited payments to general government. Source: OECD — Revenue Statistics 2025 (PRIMARY · doi.org/10.1787/3a264267-en · December 9, 2025) · Eurostat (PRIMARY · April 22, 2026 · EU 2024 final data, including social contributions).

🇩🇰 Denmark
#1 OECD 2024 · 2nd consecutive year · world-class welfare state, universal healthcare, free university
45.2%
🇫🇷 France
#2 OECD 2024 · employer SSC highest OECD at 26.7% · public healthcare, generous pensions, subsidised education
43.5%
🇦🇹 Austria
#3 OECD 2024 · SSC-heavy system · universal healthcare, generous family transfers, early retirement
43.4%
🇧🇪 Belgium
above 40% (OECD) · 45.1% incl. SSC (Eurostat) · highest OECD tax wedge on workers at 52.6% (2024)
~43%
🇭🇬 Hungary
above 40% (OECD) · flat 15% PIT · exceptionally high VAT of 27% (world’s highest standard rate) largely explains ratio
~42%
🇪🇸 Sweden
above 40% (OECD) · 42.5% (Eurostat 2024) · world-leading parental leave, universal childcare, healthcare
~42%
🇫🇮 Finland
above 40% (OECD) · 42.3% (Eurostat 2024) · Nordic social model · highest education spending ratio in OECD
~42%
🇮🇴 Norway
above 40% (OECD) · oil fund sovereign wealth · welfare state funded by mix of taxes + petroleum revenues
~41%
🇮🇹 Italy
above 40% (OECD) · 42.6% (Eurostat 2024) · high SSC · largest pension system in EU by share of GDP
~41%
🇩🇪 Germany
~37.3% (2024) · above OECD average · largest tax wedge after Belgium at 47.9% (2024) · SSC-heavy system
~37%
——— OECD Average ———
34.1% (2024) · up from 33.7% in 2023 · first annual increase since 2021 · was 24.9% in 1965
34.1%
🇬🇧 United Kingdom
~34.8% (2024) · near OECD average · NHS, public pension, housing benefit · fiscal pressure rising
~35%
🇺🇸 United States
~27.3% (2024) · well below OECD average · no federal VAT · healthcare largely private · state variation
~27%
🇮🇽 Mexico
18.3% (2024) · lowest in OECD · low VAT, major exemptions, large informal economy limits collection
18.3%
Data: OECD Revenue Statistics 2025 (PRIMARY · doi.org/10.1787/3a264267-en · December 9, 2025 · OECD Publishing). 2024 figures are preliminary for most countries (Australia and Japan not yet available for 2024). Belgium, Sweden, Finland, Norway, Italy reported as “above 40%” in OECD RS 2025 highlights; precise 2024 OECD figures approximated from Eurostat 2024 final data (PRIMARY · April 22, 2026). Definition: Tax-to-GDP ratio = total compulsory, unrequited payments to general government as % of GDP, including income taxes, payroll taxes/SSC, property taxes, VAT and consumption taxes, and corporate income taxes. Ireland confirmed at 21.3% (OECD RS 2025), Chile 20.6%; not shown due to space. Verbatim OECD RS 2025: “Across OECD countries, tax-to-GDP ratios ranged from 18.3% in Mexico to 45.2% in Denmark in 2024.”
Visualization 02 — The Tax Wedge on Labour · Single Average-Wage Worker, No Children · 2024
The Worker’s Real Burden — Belgium Takes 52.6% of Total Labour Costs in Tax

The tax wedge measures something different from the tax-to-GDP ratio: it shows what proportion of total labour costs (gross wage + employer social security contributions) is absorbed by taxes before reaching the worker’s pocket. A tax wedge of 52.6% (Belgium) means that for every €100 it costs the employer to hire the average worker, only €47.40 arrives in the worker’s bank account after income tax and social security deductions on both sides. Source: OECD — Taxing Wages 2025 (PRIMARY · doi.org/10.1787/b3a95829-en · April 30, 2025 · 2024 data). Freshest 2025 data: OECD Taxing Wages 2026 (PRIMARY · Belgium 52.5%, OECD average 35.1%).

🇧🇪 Belgium#1 OECD · both 2024 and 2025
52.6%
Personal average tax rate: 39.7% of gross wages — “the highest [personal average tax] rate” in OECD (Taxing Wages 2025). Marginal tax rate for average worker: 55.6% — above 55% only in Belgium (OECD 2025). 2025 (Taxing Wages 2026): still 52.5%, still #1. For every €100 in labour cost, the employer takes home €47.40.
🇩🇪 Germany#2 OECD · 2024
47.9%
Germany’s high total tax-to-GDP ratio (~37%) is not from a high personal income tax rate alone but from the combination of steep social security contributions on both employee and employer sides. 2025 (Taxing Wages 2026): Germany one of three countries where tax wedge increased, alongside Israel and the UK.
🇫🇷 France#3 OECD · highest employer SSC at 26.7%
47.2%
“Employers in France paid 26.7% of labour costs in SSCs, the highest amongst OECD countries.” — OECD Taxing Wages 2025 primary verbatim. France has the highest employer social security contributions in the entire OECD. This is the cost of its comprehensive healthcare (Sécurité Sociale), generous state pensions, and unemployment insurance systems.
🇮🇹 Italy#4 OECD · 2024
47.1%
Italy’s high labour cost is driven primarily by employer social security contributions. Italy spends more on pensions as a share of GDP than almost any other OECD country. Despite a 47.1% tax wedge, Italy’s total tax-to-GDP ratio is above 40% — consistent with European continental welfare state patterns. 2025: Italy among the 9 countries where the tax wedge fell.
OECD AverageSingle worker, average wage, no children
34.9%
“The tax wedge of a single worker with no children earning the average national wage was 34.9% of labour costs on average across the OECD in 2024.” — OECD Taxing Wages 2025 primary verbatim. In 2025, OECD average rose to 35.1% (Taxing Wages 2026 — freshest). Personal average tax rate alone: 25.0% of gross wages (OECD 2024 average).
Income tax
Employee social security contributions (SSC)
Employer social security contributions (SSC)
Net take-home pay
“In 2024, the largest tax wedge for this household type was observed in Belgium (52.6%), Germany (47.9%), France (47.2%), Italy (47.1%) and Austria (47.0%).” — OECD Taxing Wages 2025 primary verbatim. “In the case of a single worker earning the average wage (AW), the tax wedge ranged from zero (Colombia) and 7.2% (Chile) to 47.9% (Germany) and 52.6% (Belgium).” Freshest 2025 data (OECD Taxing Wages 2026): Belgium 52.5% still #1; Colombia 0.0% still lowest; OECD average 35.1% in 2025. Bar segments are approximate decompositions consistent with OECD Taxing Wages 2025 country data tables; the total (tax wedge) is the primary confirmed figure.

Tax comparisons are only as useful as the definitions behind them. Two countries can appear to have similar tax levels while looking completely different to the average worker — because one relies on consumption taxes and the other on labour taxes. One measures the tax burden on the whole economy as a share of GDP. Another measures what a specific average worker actually loses before their pay arrives. Both are important. Neither is sufficient alone.

OECD — Revenue Statistics 2025 (PRIMARY · oecd.org · doi.org/10.1787/3a264267-en · December 9, 2025 · OECD Publishing)
45.2%
“Across OECD countries, tax-to-GDP ratios ranged from 18.3% in Mexico to 45.2% in Denmark in 2024. Between 2023 and 2024, the OECD average tax-to-GDP ratio increased from 33.7% to 34.1%. This was the first annual increase since 2021.” — OECD Revenue Statistics 2025 primary verbatim.
Denmark’s 45.2% tax-to-GDP ratio in 2024 was the highest in the OECD “for the second consecutive year.” France was second at 43.5%, Austria third at 43.4%. Eight countries sat above 40%: alongside the three leaders, Finland, Belgium, Sweden, Norway, and Italy all cleared the threshold. The 27-point gap between Denmark’s 45.2% and Mexico’s 18.3% is one of the widest in the club of rich democracies. The OECD’s Revenue Statistics 2025, published December 9, 2025, confirms the 2024 increase was the first since 2021. Latvia saw the sharpest 2024 rise at +2.4 percentage points, driven by higher revenues from personal income tax, social security contributions, and corporate income tax. Slovenia rose +1.9pp. Colombia saw the sharpest decline at -2.2pp. In 22 of 36 countries where preliminary 2024 data was available, tax ratios rose year-on-year. The historical trend underlying the 2024 snapshot is even more significant: “Between 1965 and 2023, the average tax-to-GDP ratio among OECD countries increased from 24.9% to 33.7%, an increase of 8.9 percentage points.”
Source: OECD — Revenue Statistics 2025: Disentangling Personal Income Tax Revenue in OECD Countries (PRIMARY · doi.org/10.1787/3a264267-en · December 9, 2025 · OECD Publishing · KEY VERBATIM: “Denmark had the highest tax-to-GDP ratio among OECD countries for the second consecutive year in 2024, at 45.2%” · “France had the second-highest tax-to-GDP ratio in 2024 (43.5%) followed by Austria (43.4%)” · “Mexico had the lowest” at 18.3% · “Six other countries had tax-to-GDP ratios above 40%: Finland, Austria, Belgium, Sweden, Norway and Italy” · “Across OECD countries, tax-to-GDP ratios ranged from 18.3% in Mexico to 45.2% in Denmark in 2024” · “Between 2023 and 2024, the OECD average tax-to-GDP ratio increased from 33.7% to 34.1%” · “This was the first annual increase since 2021” · “In 2024, tax-to-GDP ratios increased from the previous year in 22 of the 36 countries for which preliminary data is available, declined in 13 countries and remained unchanged in one” · “The largest increase in 2024 was observed in Latvia, whose tax-to-GDP ratio rose by 2.4 p.p. due to higher revenues as a share of GDP from personal income tax (PIT), social security contributions and corporate income tax (CIT)” · “The second-largest increase was in Slovenia, where tax revenues rose by 1.9 p.p.” · “The largest decline in the tax-to-GDP ratio in 2024 occurred in Colombia, of 2.2 p.p.” · “Between 1965 and 2023, the average tax-to-GDP ratio among OECD countries increased from 24.9% to 33.7%, an increase of 8.9 p.p.”)

“In 2024, the largest tax wedge for this household type was observed in Belgium (52.6%), Germany (47.9%), France (47.2%), Italy (47.1%) and Austria (47.0%).”

— OECD — Taxing Wages 2025 (PRIMARY · oecd.org · doi.org/10.1787/b3a95829-en · April 30, 2025 · 2024 data · single worker, average wage, no children)

Why Nordic Countries Dominate the Top — and Why Ireland Sits at the Bottom

Denmark’s 45.2% does not come primarily from high income tax rates. It comes from a specific design choice: Denmark finances its welfare state more through individual income taxes than through social security contributions, unlike France, Germany, or Belgium. Danes pay high income taxes directly and in return receive free university education, universal healthcare, generous unemployment benefits, and one of the world’s best-funded eldercare systems. Ireland at 21.3% sits near the bottom of the OECD. This is not because Ireland has a small welfare state — it is because Ireland has an unusual tax mix, reliant on corporate income tax revenues from multinationals rather than high personal or consumption taxes. The same tax-to-GDP ratio can represent a social democratic welfare state (Denmark) or a liberal low-regulation model (Ireland), depending on what the revenue funds and how it is collected.

Why it matters: high tax-to-GDP ratios are not inherently good or bad. They reflect choices about what governments provide. Denmark’s 45.2% funds a social contract that includes free university education, universal healthcare, world-class parental leave, and active labour market programmes. These services cost money. The question is not whether 45.2% is too much or too little — it is whether the services provided are worth what is collected.
OECD — Taxing Wages 2025 (PRIMARY · doi.org/10.1787/b3a95829-en · April 30, 2025 · 2024 data) + OECD — Taxing Wages 2026 (PRIMARY · oecd.org · 2025 data · FRESHEST)
52.6%
Belgium’s tax wedge in 2024 — the share of total labour costs absorbed by income taxes and social security contributions. “In the case of a single worker earning the average wage (AW), the tax wedge ranged from zero (Colombia) and 7.2% (Chile) to 47.9% (Germany) and 52.6% (Belgium).” — OECD Taxing Wages 2025 primary verbatim. 2025: Belgium 52.5%, still #1 (Taxing Wages 2026, freshest).
The tax wedge is the metric that matters most to employers making hiring decisions and workers evaluating job offers. Belgium’s 52.6% in 2024 means that of every €100 an employer spends on labour, only €47.40 reaches the worker after all income taxes and social security contributions on both sides are deducted. Belgium’s personal average tax rate — income tax alone, as a share of gross wages — was 39.7% in 2024, the highest in the OECD. “Denmark, Germany, Lithuania and Slovenia were the only other countries with rates above 35%.” Belgium’s marginal tax rate for the average worker was 55.6% in 2024 — “higher than 55% only in Belgium” across the entire OECD. France had the highest employer social security contributions at 26.7% of labour costs — “the highest amongst OECD countries” (OECD Taxing Wages 2025 verbatim) — and this is why France’s tax wedge (47.2%) approaches Germany and Italy despite France having a lower total tax-to-GDP ratio than some Nordic countries. The OECD average tax wedge was 34.9% in 2024 and rose to 35.1% in 2025 (Taxing Wages 2026). In 2025, nine countries saw their tax wedge decline: Australia, Denmark, Iceland, Ireland, Italy, Latvia, Portugal, Sweden, and the United States.
Source: OECD — Taxing Wages 2025 (PRIMARY · doi.org/10.1787/b3a95829-en · April 30, 2025 · KEY VERBATIM: “In 2024, the largest tax wedge for this household type was observed in Belgium (52.6%), Germany (47.9%), France (47.2%), Italy (47.1%) and Austria (47.0%)” · “The tax wedge of a single worker with no children earning the average national wage was 34.9% of labour costs on average across the OECD in 2024” · “In the case of a single worker earning the average wage (AW), the tax wedge ranged from zero (Colombia) and 7.2% (Chile) to 47.9% (Germany) and 52.6% (Belgium)” · “Belgium had the highest rate [personal average tax], at 39.7%; Denmark, Germany, Lithuania and Slovenia were the only other countries with rates above 35%” · “The personal average tax rate for this household type was 25.0% of gross wage earnings in 2024” · “The marginal tax rate for the average worker was higher than 55% only in Belgium (55.6%)” · “Employers in France paid 26.7% of labour costs in SSCs, the highest amongst OECD countries”) + OECD — Taxing Wages 2026 (PRIMARY · oecd.org/en/publications/taxing-wages-2026_3a5169ef-en · 2025 data · FRESHEST · KEY VERBATIM: “The largest tax wedge was observed in Belgium (52.5%) and the lowest in Colombia (0.0%)” · “the average tax wedge as a percentage of labour costs in OECD countries was 35.1% in 2025”)

The 60-Year Rise — 24.9% in 1965 to 34.1% Today

The long-run OECD average tells a story of slow, sustained growth in the state’s share of the economy. In 1965, the average OECD country collected taxes equivalent to 24.9% of GDP. By 2023, that had risen to 33.7% — an increase of 8.9 percentage points over 58 years. In 2024, it ticked up again to 34.1%, the first increase since 2021. The direction has been consistent: more taxes, not fewer. The reasons are structural. Ageing populations require more spending on pensions and healthcare. Welfare states expanded after World War II and their costs have grown with demographics. Public debt servicing costs have risen as debt levels increased. And the COVID-19 pandemic’s fiscal legacy — emergency spending financed by borrowing — has created pressure to raise revenues in the years since. The 2024 increase, with 22 of 36 countries raising their ratios, suggests this structural pressure is back after two years of post-COVID correction.

Why it matters: the OECD average rising from 24.9% to 34.1% in six decades is not primarily a story of tax grabs. It is a story of expanding social contracts — healthcare systems, pension systems, disability support, and education — that required more revenue as populations aged and expectations rose. The question for the next 60 years is whether rising spending pressures (climate adaptation, defence, AI transition, demographic ageing) will push that average toward 40%, and what the political economy of that shift looks like country by country.
Key Numbers at a Glance
Tax-to-GDP · #1 OECD · 2024
45.2%
Denmark’s tax-to-GDP ratio in 2024 — highest in the OECD for the second consecutive year. France #2 (43.5%), Austria #3 (43.4%). Mexico lowest at 18.3%.
OECD Revenue Statistics 2025
Tax Wedge · #1 OECD · 2024
52.6%
Belgium’s tax wedge in 2024 — the highest in the OECD for a single average-wage worker. Germany #2 (47.9%). Colombia lowest at 0.0%. OECD average: 34.9%.
OECD Taxing Wages 2025
OECD Average · 2024 · 60-year trend
34.1%
OECD average tax-to-GDP in 2024 — up from 33.7% in 2023. First annual increase since 2021. Up from 24.9% in 1965 — +9.2pp in six decades. Tax wedge average: 35.1% in 2025.
OECD Revenue Statistics 2025
Lowest OECD · 2024
18.3%
Mexico’s tax-to-GDP ratio in 2024 — lowest in the OECD. Chile: 20.6%. Ireland: 21.3% (lowest EU). The 27pp gap between Mexico and Denmark is the full range of rich-country tax policy.
OECD Revenue Statistics 2025
Frequently Asked Questions
Which country has the highest taxes in the world?
Among OECD countries — the world’s most comprehensive group of rich democracies with comparable tax data — Denmark had the highest tax-to-GDP ratio in 2024 at 45.2%, for the second consecutive year (OECD Revenue Statistics 2025, primary, December 9, 2025). France was second at 43.5%, Austria third at 43.4%. In the EU including social security contributions, Eurostat (April 22, 2026) reports Denmark at 45.8%, France at 45.3%, and Belgium at 45.1%. For individual workers, Belgium has the highest tax burden: its tax wedge — the share of total labour costs taken by income taxes and social security contributions — reached 52.6% for a single average-wage worker in 2024, the highest in the OECD (OECD Taxing Wages 2025, primary).
What is the difference between the tax-to-GDP ratio and the tax wedge?
They measure different things. The tax-to-GDP ratio is the broadest measure: total taxes collected by the government (income, corporate, VAT, property, social security) as a percentage of GDP. Denmark’s 45.2% means its government collects taxes equal to nearly half the country’s entire economic output. The tax wedge is more specific: it measures what fraction of total labour costs (gross wage + employer social security contributions) is taken in taxes for a particular type of worker — typically a single average-wage worker with no children. Belgium’s 52.6% tax wedge means 52.6 cents of every euro a company spends on that worker goes to taxes, leaving 47.4 cents in the worker’s pocket. Both measures matter, but for different purposes: one captures the overall fiscal footprint, the other the worker-level tax experience.
Which country has the lowest taxes in the OECD?
Mexico has the lowest tax-to-GDP ratio in the OECD at 18.3% in 2024 (OECD Revenue Statistics 2025, primary). Chile (20.6%) and Ireland (21.3%) are the next lowest. For individual workers, Colombia has a tax wedge of 0.0% for a single average-wage worker — “a single worker earning the average wage did not pay personal income taxes in 2025” and their social security contributions are classified as non-tax compulsory payments (OECD Taxing Wages 2026, primary, freshest). Chile’s tax wedge was 7.2% in 2024, the next lowest after Colombia. The OECD total range in 2024: 18.3% (Mexico) to 45.2% (Denmark) on tax-to-GDP; 0% (Colombia) to 52.6% (Belgium) on tax wedge.
How have global tax levels changed over time?
Significantly. “Between 1965 and 2023, the average tax-to-GDP ratio among OECD countries increased from 24.9% to 33.7%, an increase of 8.9 percentage points.” (OECD Revenue Statistics 2025, primary verbatim). In 2024, it rose further to 34.1% — the first annual increase since 2021. This long-run increase reflects expanding welfare states (healthcare, pensions, education) as populations aged and political economies converged on more extensive public services. The 2024 uptick, with 22 of 36 OECD countries increasing their ratios, reflects spending pressures from post-COVID fiscal consolidation requirements, defence spending increases (particularly in Europe), and welfare system cost growth.
Does the US have high or low taxes compared to other rich countries?
Low, by OECD standards. The US tax-to-GDP ratio is approximately 27.3% in 2024 — well below the OECD average of 34.1% and dramatically below Denmark’s 45.2%. The US has no federal value-added tax (VAT), relies heavily on state and local variation, and funds healthcare largely through private insurance rather than public taxation. For average workers, the US tax wedge is below the OECD average of 34.9%. The US also had one of the nine countries where the tax wedge fell in 2025 (OECD Taxing Wages 2026, primary). The US’s relatively low tax burden compared to other wealthy democracies is matched by lower public spending on healthcare, parental leave, childcare subsidies, and higher education subsidies than most OECD peers.
Sources
  • OECD — Revenue Statistics 2025: Disentangling Personal Income Tax Revenue in OECD Countries (PRIMARY · oecd.org/en/publications/revenue-statistics-2025_3a264267-en.html · doi.org/10.1787/3a264267-en · December 9, 2025 · OECD Publishing · KEY VERBATIM: “Denmark had the highest tax-to-GDP ratio among OECD countries for the second consecutive year in 2024, at 45.2%” · “France had the second-highest tax-to-GDP ratio in 2024 (43.5%) followed by Austria (43.4%)” · “Mexico had the lowest” at 18.3% · “Six other countries had tax-to-GDP ratios above 40%: Finland, Austria, Belgium, Sweden, Norway and Italy” · “Across OECD countries, tax-to-GDP ratios ranged from 18.3% in Mexico to 45.2% in Denmark in 2024” · “Between 2023 and 2024, the OECD average tax-to-GDP ratio increased from 33.7% to 34.1%” · “This was the first annual increase since 2021” · “In 2024, tax-to-GDP ratios increased from the previous year in 22 of the 36 countries for which preliminary data is available, declined in 13 countries and remained unchanged in one” · Latvia +2.4pp · Slovenia +1.9pp · Colombia -2.2pp · “Between 1965 and 2023, the average tax-to-GDP ratio among OECD countries increased from 24.9% to 33.7%, an increase of 8.9 p.p.” · Ireland 21.3% · Chile 20.6%)
  • OECD — Taxing Wages 2025 (PRIMARY · oecd.org/en/publications/taxing-wages-2025_b3a95829-en.html · doi.org/10.1787/b3a95829-en · April 30, 2025 · OECD Publishing · 2024 data · KEY VERBATIM: “In 2024, the largest tax wedge for this household type was observed in Belgium (52.6%), Germany (47.9%), France (47.2%), Italy (47.1%) and Austria (47.0%)” · “The tax wedge of a single worker with no children earning the average national wage was 34.9% of labour costs on average across the OECD in 2024” · “In the case of a single worker earning the average wage (AW), the tax wedge ranged from zero (Colombia) and 7.2% (Chile) to 47.9% (Germany) and 52.6% (Belgium)” · “Belgium had the highest rate, at 39.7%; Denmark, Germany, Lithuania and Slovenia were the only other countries with rates above 35%” · “The personal average tax rate for this household type was 25.0% of gross wage earnings in 2024” · “The marginal tax rate for the average worker was higher than 55% only in Belgium (55.6%)” · “Employers in France paid 26.7% of labour costs in SSCs, the highest amongst OECD countries”)
  • OECD — Taxing Wages 2026 (PRIMARY · oecd.org/en/publications/taxing-wages-2026_3a5169ef-en · April/May 2026 · OECD Publishing · 2025 data · FRESHEST AVAILABLE · KEY VERBATIM: “The largest tax wedge was observed in Belgium (52.5%) and the lowest in Colombia (0.0%)” · “In Colombia, a single worker earning the average wage did not pay personal income taxes in 2025” · “the average tax wedge as a percentage of labour costs in OECD countries was 35.1% in 2025” · 9 countries where wedge fell in 2025: Australia, Denmark, Iceland, Ireland, Italy, Latvia, Portugal, Sweden, United States · Germany, Israel, UK saw increases)
  • Eurostat — Tax Revenue Statistics (PRIMARY · ec.europa.eu/eurostat/statistics-explained/index.php?title=Tax_revenue_statistics · updated April 22, 2026 · EU 2024 final data including social contributions · KEY DATA: Denmark 45.8%, France 45.3%, Belgium 45.1%, Austria 43.8%, Luxembourg 42.7%, Italy 42.6%, Sweden 42.5%, Finland 42.3% · EU average 40.4% of GDP in 2024, up from 39.9% in 2023 · Ireland 22.4% lowest EU · Romania 28.8%, Malta 29.3% next lowest)
  • European Commission — Data on Taxation Trends (PRIMARY · taxation-customs.ec.europa.eu · released March 31, 2026 · EU-27 member states collected €7.1 trillion in taxes in 2024, +5.6% from 2023 · EU-27 tax-to-GDP: 39.4% in 2024 · Denmark 45.2%, France 43.5%, Austria 43.4% highest · Ireland 21.7%, Romania 27.9%, Malta 28.8% lowest EU-27 · “labour taxes grew by 6.6% in nominal terms, driven by rising salaries and a strong labour market”)
Macro Discovery

Sukh Dhaliwal

Sukh Dhaliwal is the founder of Macro Discovery, an independent digital publication covering AI, technology, science, future trends, and global innovation through visual storytelling and data-driven analysis.

Join WhatsApp

Join Now

Join Facebook

Follow us

Leave a Comment