The Economics of Inflation —
Why Prices Rise and Who Suffers Most
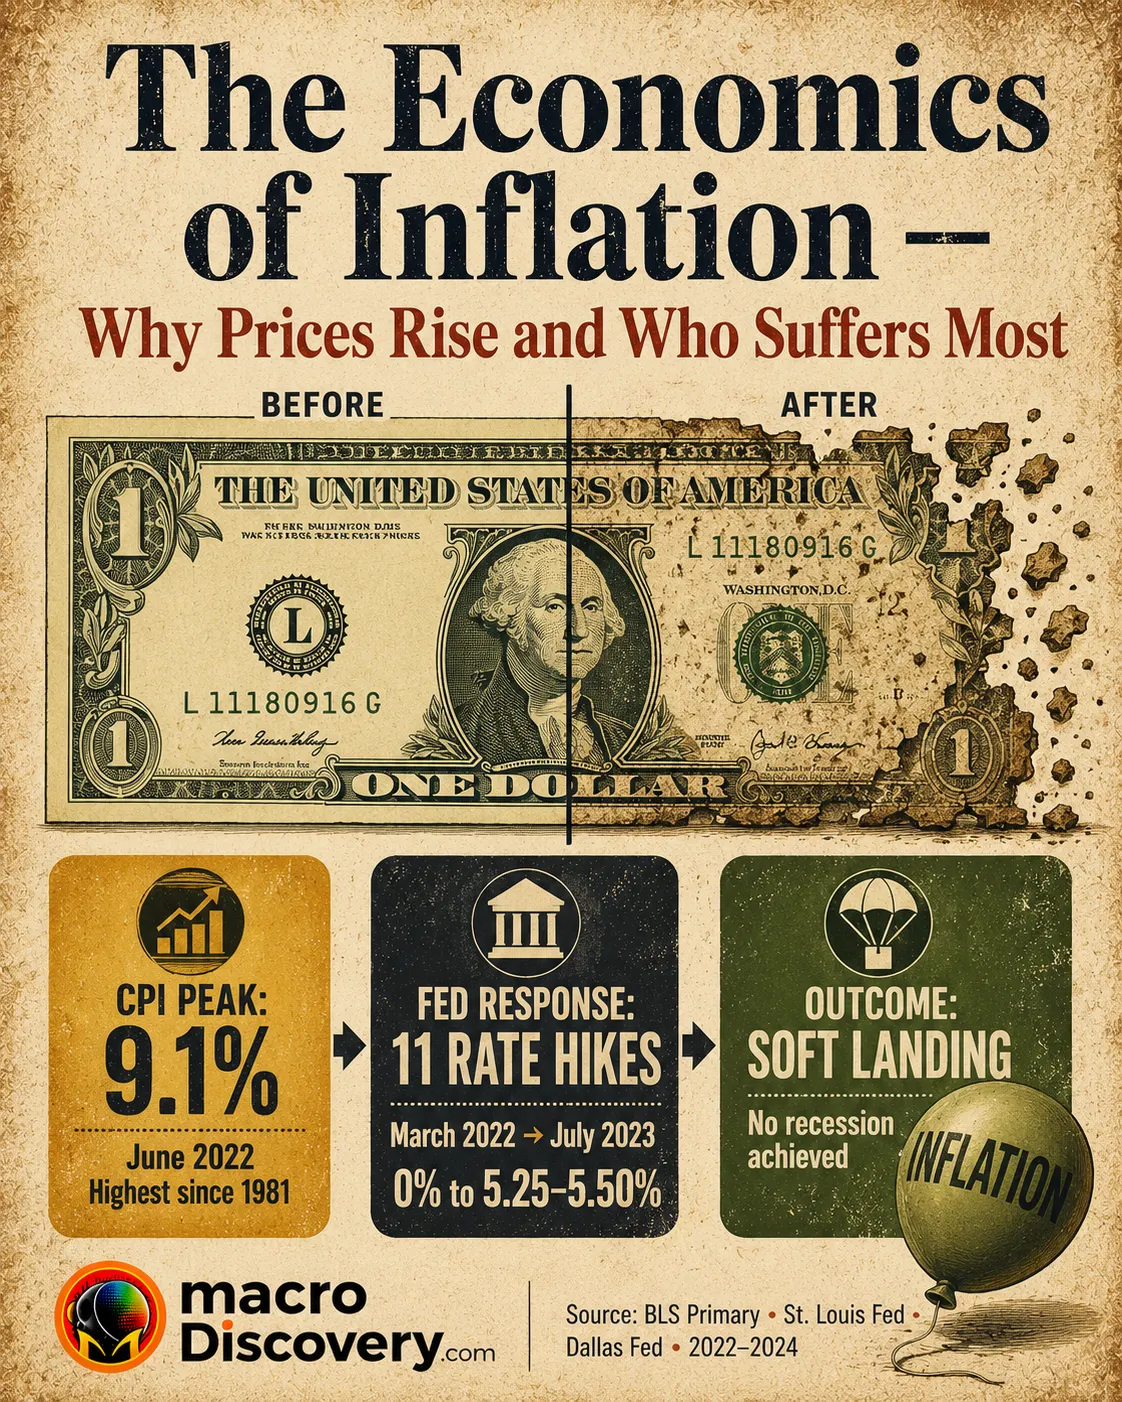
Between 2021 and 2023, inflation erased approximately 17% of the US dollar’s purchasing power — the largest two-year erosion since the 1970s oil shock. The Federal Reserve responded with 11 interest rate increases in 16 months, its fastest tightening cycle in four decades. Central banks raising rates to fight inflation is not a treatment without side effects — it is a deliberate mechanism that works by slowing the economy. Whether the cure is proportionate to the disease is the most contested question in economics right now.
| Country / Metric | Peak inflation rate | Period | Response | Status (mid-2026) |
|---|---|---|---|---|
| 🇺🇸 United States | 9.1% (CPI) | June 2022 | Fed: 11 hikes in 16 months. 0% → 5.25–5.5%. Fastest tightening since 1980s. “Soft landing” achieved: disinflation without recession. | Rising again: 4.2% May 2026 (tariffs + Iran energy) |
| 🇪🇺 Eurozone | 8.1% | May 2022 | ECB: first rate hike in 11 years (July 2022). Slower to respond than Fed. Euro fell vs dollar. Energy dependence on Russia made impact harder. | Broadly resolved |
| 🇬🇧 United Kingdom | ~11% | Late 2022 | Bank of England raised rates through 2022–2023. Higher food import costs post-Brexit amplified the impact. Wage pressure became key inflation driver through 2023. | Declining |
| 🇹🇷 Turkey | 85.5% | 2022 peak | Government initially LOWERED rates despite inflation (unorthodox monetary theory). Reversed course in 2023. Lira lost 90%+ of value since 2018. Currency-driven inflation spiral. | Still elevated |
| 🇦🇷 Argentina | 94.8% | 2022 | Structural: chronic monetary financing of deficits, dollar debt, recurring crises. 2024 Milei shock therapy: deep spending cuts. Inflation fell sharply but at high social cost. | Falling but fragile |
| 🇪🇺 Global IMF avg | 8.8% | 2022 | Worldwide surge driven by common factors: pandemic fiscal expansion, supply chain disruption, Ukraine war energy shock. Low-income countries hit hardest on food costs. | Broadly easing |
Sources: US CPI 9.1% and cumulative data: Bureau of Labor Statistics (BLS, primary). Fed hike cycle (11 hikes, March 2022 to July 2023, 5.25–5.5% peak): Federal Open Market Committee / The Street (January 2026). St. Louis Fed Annual Report 2023 (primary, directly fetched): PCE peaked 7.1% June 2022. Eurozone 8.1% / ECB: Wikipedia citing Eurostat. UK ~11%: Wikipedia. Turkey 85.5%: multiple confirmed. Argentina 94.8%: Investment Monitor citing IMF. Global IMF 8.8%: IMF WEO 2022. US April–May 2026: Trading Economics / BLS (Iran energy shock + tariff pass-through).
What Actually Caused the 2021–2023 Inflation Surge?
Three forces collided simultaneously. First, the US government deployed approximately $5.2 trillion in fiscal stimulus between March 2020 and March 2021, flooding the economy with demand. Second, pandemic supply chains had been stripped back: factory closures, shipping delays, and semiconductor shortages meant that demand recovery ran into constrained supply. Goods prices drove 58% of the initial inflation surge (Bankrate citing BLS). Third, Russia’s February 2022 invasion of Ukraine sent energy and food prices surging globally — energy alone accounted for 32% of US inflation during the initial peak. These were not separate events; they were a chain reaction in which each shock reinforced the next, and by June 2022 the US CPI reached 9.1% — its highest level since 1981.
Why it matters: the 2021–2023 inflation was not one thing — it was three compounding shocks, which is why no single policy response was perfectly calibrated to address it.
Does Raising Interest Rates Deliberately Cause Unemployment — and Is That the Point?
The Federal Reserve raised its benchmark rate 11 times between March 2022 and July 2023 — from effectively zero to 5.25–5.50%, its fastest tightening cycle in four decades. This is the standard inflation-fighting tool, and its mechanism is deliberately contractionary: higher rates make borrowing more expensive for businesses and consumers, reducing spending, slowing the economy, and ultimately reducing the demand pressure on prices. The Phillips Curve relationship — the historical trade-off between inflation and unemployment — means that monetary tightening is expected to slow job creation. The remarkable outcome in the US was that this cycle achieved a “soft landing”: CPI fell from 9.0% to 3.0% in under 18 months without a recession, described by analysts as the fastest disinflation in modern history (eco3min citing BLS).
Why it matters: the Fed’s 2022–2023 success in achieving disinflation without recession will define monetary policy doctrine for the next generation of central bankers.
Who Does Inflation Hurt Most — and Who Quietly Benefits?
Federal Reserve Chair Jay Powell stated plainly: “The burdens of high inflation fall heaviest on those who are least able to bear them.” The data confirms this. At the June 2022 peak, middle-income households experienced inflation running at 19% annualised, low-income households at 18.6%, and high-income households at approximately 16% (Minneapolis Fed, 2024). Renters were especially exposed: 56.5% of renters reported being “very stressed” by inflation versus 39.3% of mortgage-free homeowners (Dallas Fed, January 2023). The distributional asymmetry runs deeper: savers holding cash lose purchasing power; borrowers with fixed-rate mortgages see their real debt eroded; governments see nominal tax revenues rise while fixed national debt shrinks in real terms. Inflation is not neutral — it redistributes wealth from creditors to debtors, from renters to owners, from the unorganised to those with pricing power.
Why it matters: inflation functions as an invisible, regressive tax — most painful for those who cannot protect their income or assets against rising prices.
What Is “Sellers’ Inflation” — and Why Did It Become the Most Debated Economic Idea of 2023?
Isabella Weber, associate professor of economics at the University of Massachusetts Amherst, co-authored a 2023 paper with Evan Wasner arguing that the standard demand-pull and cost-push explanations for inflation were incomplete. Analysing more than 130,000 corporate earnings calls using AI tools, they found that large firms used the widespread cost shock of 2021–2022 as an “implicit coordination mechanism” — a signal to raise prices more than their own cost increases warranted. In sectors like energy and commodities, companies that had closed high-cost capacity during the pandemic demand collapse were positioned to generate record profits when demand recovered: global fossil fuel profits reached US$916 billion in 2022 alone. Weber’s paper was initially attacked by mainstream economists before subsequently becoming one of the most cited economic analyses of that period (The New Yorker, June 2023). The debate it opened is not resolved: it asks whether monetary tightening — which works by suppressing demand and employment — is the right response to inflation partly driven by corporate pricing decisions.
Turkey (2022 peak: 85.5%): President Erdoãan held that high interest rates cause inflation — the inverse of orthodox economics. The government cut rates through 2022 as inflation surged. The Turkish lira lost over 90% of its value since 2018. Turkey reversed course in 2023, raising rates sharply. The episode cost Turkish citizens enormous purchasing power losses and became a textbook case of what happens when monetary policy is subordinated to political theory.
Argentina (2022 peak: 94.8%): A structural rather than policy-driven case — decades of monetary financing of government deficits, recurring currency crises, and dollar-denominated debt created a chronic inflation cycle. President Milei’s 2024 “shock therapy” involved deep government spending cuts that rapidly reduced inflation but at significant social cost. Argentina’s inflation history is a warning about fiscal foundations: monetary policy cannot sustainably substitute for a government’s inability to finance itself without printing money.
Sources: Wikipedia citing Eurostat/IMF/Trading Economics · Investment Monitor · IMF WEO 2022.
Why it matters: if inflation is partly driven by corporate pricing decisions rather than purely by demand excess, the appropriate policy response is not obviously a blunt interest rate tool that works by creating unemployment.
- US CPI peaked at 9.1% in June 2022 — the highest since 1981 — erasing approximately 17% of the dollar’s purchasing power across the full 2021–2023 episode (BLS primary).
- The Fed raised rates 11 times in 16 months (March 2022 to July 2023), from near-zero to 5.25–5.50% — the fastest tightening cycle in four decades.
- A “soft landing” was achieved: CPI fell from 9.0% to 3.0% in under 18 months without a recession — described as the fastest disinflation in modern history.
- Inflation hits low-income households and renters hardest: 56.5% of renters reported being “very stressed” vs 39.3% of mortgage-free homeowners (Dallas Fed, 2023).
- Isabella Weber’s “sellers’ inflation” paper (Weber & Wasner, 2023, UMass Amherst) analysed 130,000+ earnings calls to argue corporations used cost shocks to expand profit margins beyond cost increases.
- Global fossil fuel profits reached $916 billion in 2022 — record profits achieved as energy firms benefited from supply constraints they had partly created.
- Turkey (85.5%) and Argentina (94.8%) show the extremes: one driven by unorthodox monetary policy, one by chronic fiscal deficit monetisation.
Inflation is not a single phenomenon with a single cause or a single cure. The 2021–2023 surge was simultaneously a demand shock, a supply shock, an energy crisis, and — if Weber and Wasner are right — a pricing-power crisis. The Federal Reserve’s blunt instrument of interest rate increases worked better than most predicted, achieving disinflation without recession. But it worked by making borrowing more expensive, which was hardest on those who could least afford it. The same inflation that erased savings for renters on fixed incomes delivered record profits to energy companies. That asymmetry is the unresolved political economy of every inflation cycle in history.
- Federal Reserve Bank of St. Louis — Annual Report 2023: “The Recent U.S. Inflation Experience” (primary · directly fetched · stlouisfed.org · “In March 2022, it lifted the federal funds rate from zero and began a series of increases” · PCE peaked June 2022 at 7.1% · fell throughout 2023 · Phillips curve “flat 1995–2019” / “vertical since 2022”)
- The Street — “A Timeline of the Fed’s ’22–’23 Rate Hikes” (January 2026 · “The Fed hiked interest rates a total of 11 times between March 2022 and July 2023” · peaked 5.25–5.50% · last hike July 27, 2023 · “highest since 2001” · GDP +3.3% Q4 2023 · soft landing confirmed)
- Dallas Federal Reserve — “High inflation disproportionately hurts low-income households” (January 2023 · primary · 56.5% of renters “very stressed” vs 39.3% of owners w/o mortgage · Powell quote: “burdens of high inflation fall heaviest on those least able to bear them” · Black and Hispanic households disproportionately affected)
- Federal Reserve Bank of Minneapolis — “Lower Income, Higher Inflation? New Data Bring Answers At Last” (October 2024 · June 2022 peak: middle quintile 19% annualised · low-income 18.6% · high-income ~16% · by 2023 housing costs made inflation highest for low-income families)
- Groundwork Collaborative — Weber & Wasner (2023) “Sellers’ Inflation” papers summary (130,000+ earnings calls · AI analysis · “implicit coordination mechanism” · oil/gas US$916B profits 2022 globally · bottom 50% received 1% of windfall · “Distributional Implications and Share Ownership of Record Oil and Gas Profits”)
- Eco3min Research — “The Inflation Tax: 113 Years of US CPI Data (1913–2026)” (BLS primary basis · “cumulative log-CPI increase approximately 16% price-level increase” for 2021–2023 episode · CPI 262.7 Jan 2021 → 296.3 Sept 2022 · YoY 9.0% to 3.0% in <18 months · $5.2 trillion stimulus March 2020–March 2021)
- Wikipedia — “2021–2023 inflation surge” (comprehensive sourced aggregate · BLS/Fed basis · CPI 5% May 2021 / 9.1% June 2022 / individual hike dates and amounts · US wage data by quintile · EU 8.1% · Argentina & Turkey comparison · IMF global 8.8% 2022)