
Inside the Global
Coffee Supply Chain
Brazil and Vietnam grow half the world’s coffee. Eighty percent of it is grown by smallholder farmers on plots of less than a hectare. Prices nearly tripled in five years — and fell again just as fast. Yet farmers absorb the volatility while traders, roasters, and retailers keep the margins. Here is how the world’s most traded agricultural commodity actually works.
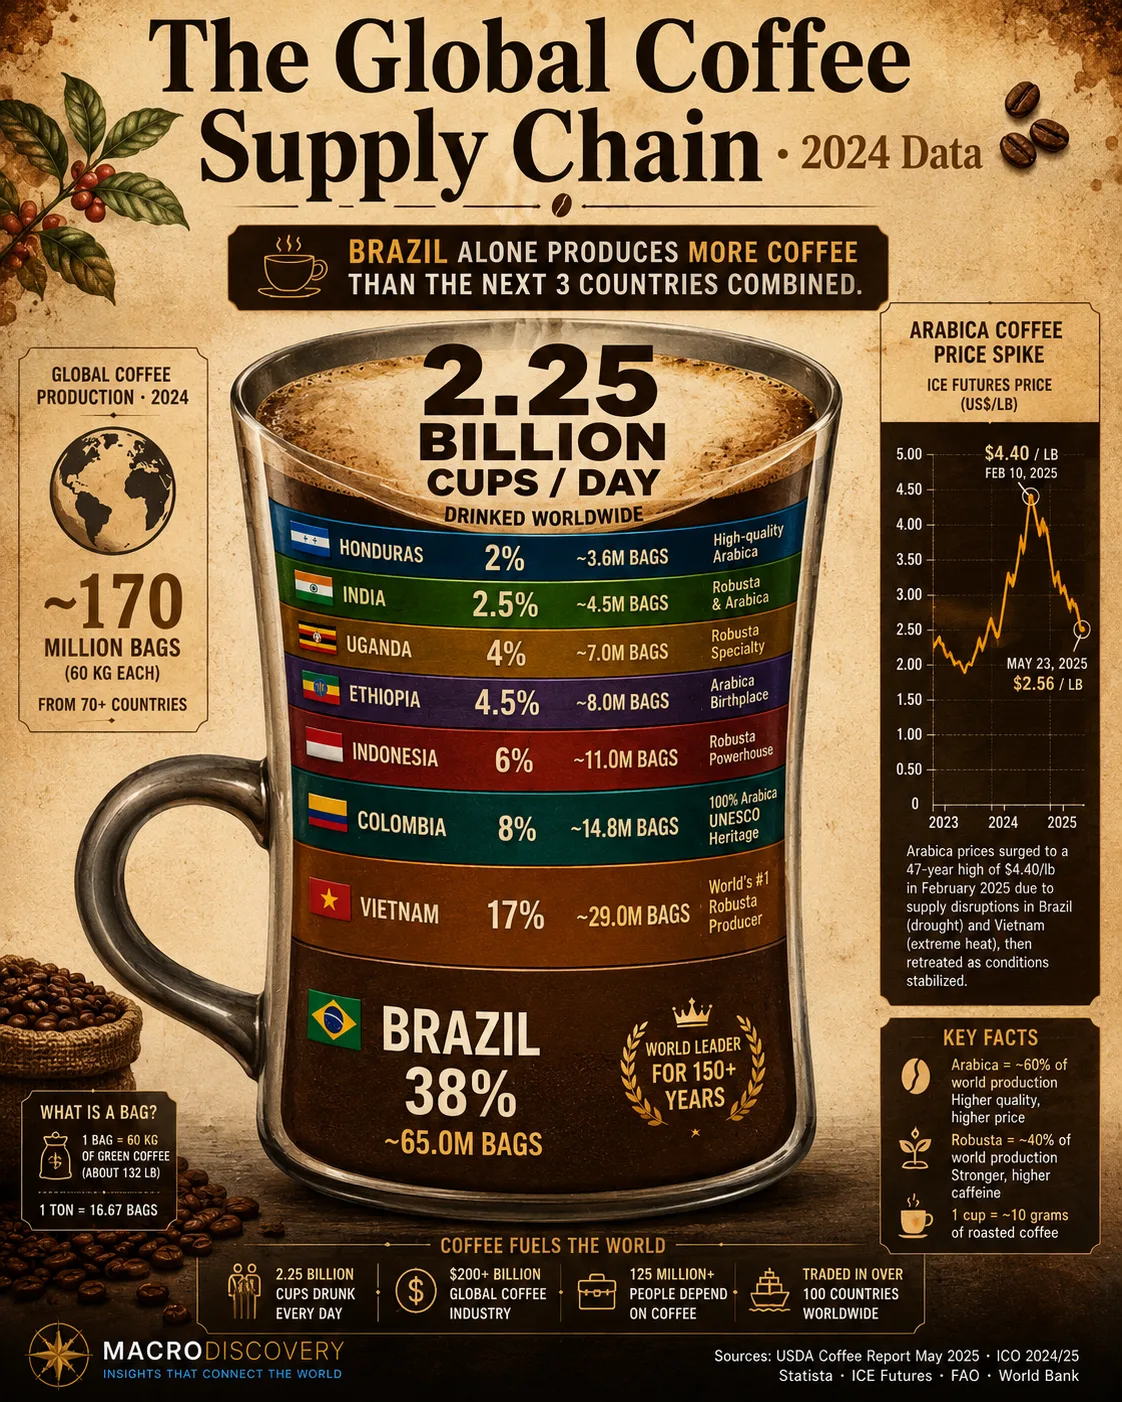
- Brazil is the world’s largest coffee producer by a wide margin — generating approximately 65 million 60-kg bags in coffee year 2023/24, or 38% of global supply. Vietnam ranks second at ~17%. Together they produce more than half the world’s coffee.
- 80% of world coffee is grown by smallholder farmers, according to the FAO — most on plots of less than a hectare. Yet when prices spike or crash, farmers absorb the volatility while traders and roasters maintain their margins, according to the Coffee Barometer 2026.
- Global coffee demand now exceeds supply. The world consumed approximately 177 million 60-kg bags in coffee year 2023/24 while producing a similar or lower volume. Ending stocks have fallen for five consecutive years (USDA FAS 2025), keeping prices structurally elevated.
- Coffee prices nearly tripled over five years (ICO composite index). Arabica futures hit an all-time high near $4.40 per pound in February 2025. By March 2026 prices had fallen back significantly — but remained high by historical standards. The primary driver: climate shocks in Brazil and Vietnam.
- The EU Deforestation Regulation (EUDR) — which requires coffee sold in Europe to be certified deforestation-free — has been delayed twice and now applies from December 30, 2026 for large operators. It will reshape sourcing, traceability, and compliance costs across the supply chain.
| # | Country | Production (Mb) | Global Share | Type | Key Region | Share |
|---|---|---|---|---|---|---|
| 1 | 🇧🇷Brazil |
~65.0 | 38% | Arabica + Robusta | Minas Gerais, São Paulo, Espírito Santo. World leader 150+ years. | |
| 2 | 🇻🇳Vietnam |
~29.0 | 17% | Robusta (>95%) | Central Highlands: Dak Lak, Lam Dong, Gia Lai. World’s #1 Robusta producer. | |
| 3 | 🇨🇴Colombia |
~14.8 | 8% | Arabica (100%) | Andean highlands: Huila, Antioquia. UNESCO Coffee Cultural Landscape. | |
| 4 | 🇮🇩Indonesia |
~12.0 | 7% | Both | Sumatra (Robusta dominant). Aceh, Toraja for Arabica. | |
| 5 | 🇪🇹Ethiopia |
~9.0 | 5% | Arabica (100%) | Birthplace of coffee. Yirgacheffe, Sidama, Kaffa. Coffee = 33.8% of exports. | |
| 6 | 🇺🇬Uganda |
~6.5 | 4% | Robusta dominant | Coffee = 15.4% of Uganda’s export earnings. Growing Arabica in eastern highlands. | |
| 7 | 🇮🇳India |
~6.0 | 4% | Both (~50/50) | Karnataka, Kerala, Tamil Nadu. Monsooned Malabar specialty. | |
| 8 | 🇭🇳Honduras |
~5.5 | 3% | Arabica (100%) | Largest producer in Central America. High-altitude shade-grown farms. |
Sources: USDA FAS World Markets and Trade: Coffee (December 2025) · FAO FAOSTAT 2023 (via Wikipedia, production shares) · Visual Capitalist citing USDA (February 2025). Production figures are for coffee year 2023/24. “Mb” = million 60-kilogram bags. Uganda and India figures are approximate based on export data and regional estimates. FAO: “Brazil and Viet Nam together account for nearly 50 percent of world coffee production.” Click column headers to sort.
Sources: FAO “Adverse climatic conditions drive coffee prices to highest level in years” (March 2025, primary) — 2024 average Arabica +58% YoY, Robusta +70% YoY. Coffee Barometer 2026 (Daily Coffee News, July 2026) — February 2025 peak ~$4.40/lb; ICO Composite Indicator Price March 2026 = 273.70 cents/lb (ICO I-CIP record of 354.52 c/lb in February 2025). USDA FAS: “ICO prices nearly tripled during this period.” Pre-2024 prices are approximate from public ICO data series.
Total volume sources: Economy Insights (citing ICO/USDA/ReportLinker 2023) · European Coffee Report 2024 (Germany). Per capita: ICO data via verenastreet.com. Note: Germany imports large volumes of green beans, roasts them, and re-exports roasted coffee — making it both a major importer and a major exporter of processed coffee. Brazil is the world’s largest producer AND second-largest consumer. Total volume and per capita rankings tell different stories.
Why Do Brazil and Vietnam Dominate Global Coffee Production?
Coffee grows only in the tropics — in a band between the Tropic of Cancer and the Tropic of Capricorn known as the “Bean Belt.” Within that zone, ideal conditions require mild temperatures (15–24°C), ample and well-distributed rainfall, specific soil acidity, and elevation. This geography severely limits where coffee can be grown, concentrating supply in a handful of countries that happen to combine the right climate, land area, and labour costs.
Brazil has dominated global coffee production for over 150 years. Its combination of vast tropical land area, mechanised farming (unique in coffee — most countries pick by hand), and ability to grow both Arabica and Robusta gives it structural advantages no competitor has replicated. At 38% of global supply, Brazil alone produces more coffee than the next three producers combined. Vietnam’s rise is more recent: French colonialists introduced coffee in the 1800s, but the country’s modern industry was built after the 1986 Doi Moi economic reforms opened the sector to private investment. Vietnam now produces more than 95% Robusta — the hardier, lower-altitude variety used primarily in instant coffee and espresso blends — and accounts for roughly 40% of global Robusta supply.
The concentration creates risk. When drought struck Brazil in 2024 — with 110,000 wildfires burning across Minas Gerais and São Paulo — global coffee markets felt it immediately. When Vietnam had a drought in its 2023/24 crop year, exports fell sharply and prices spiked. Two countries, two weather systems, one global commodity.
What Are Arabica and Robusta — and Why Does It Matter?
Coffee comes in two main commercially traded species. Arabica (Coffea arabica) is the premium variety — grown at higher altitude, requiring cooler temperatures, more susceptible to disease, more complex in flavour, and more expensive. It accounts for roughly 55–60% of global production and dominates the specialty and filter coffee market. Colombia, Ethiopia, Honduras, and Kenya produce only Arabica. Brazil produces a large proportion of its output as Arabica.
Robusta (Coffea canephora) is hardier, lower-altitude, higher in caffeine, and significantly cheaper. It has a stronger, more bitter taste and is used primarily in instant coffee, commercial espresso blends, and as a filler in lower-cost products. Vietnam grows more than 95% Robusta and is the world’s dominant Robusta supplier. Indonesia and Uganda are also major Robusta producers.
In 2024, something unusual happened: Robusta prices nearly doubled while Arabica prices also hit multi-year highs, temporarily narrowing the price differential between the two to its smallest level since the mid-1990s, according to the FAO. Normally Arabica commands a significant premium. The narrowing reflected the severity of drought in Vietnam — which supplies so much of the world’s Robusta that a production shortfall immediately pushed global prices up — at the same time as Brazil’s Arabica crop was affected by drought.
Why Did Coffee Prices Nearly Triple — and Who Benefited?
In 2020, Arabica coffee traded at around $1.00 per pound. By February 2025, futures hit an all-time high near $4.40 per pound — a more-than-fourfold increase in five years. The ICO Composite Indicator Price, which tracks the full market, hit a record monthly average of 354.52 cents per pound in February 2025. The FAO confirmed that average world coffee prices rose 38.8% in 2024 alone versus the previous year.
The cause was structural: demand has grown steadily while supply has been squeezed by climate events. Droughts in Brazil, droughts in Vietnam, excessive rainfall in Indonesia, shortfalls in Colombia — each individually manageable, but occurring in combination with a five-year stretch of global consumption exceeding production. Ending stocks have fallen for five consecutive years, according to the USDA, leaving the market with minimal buffer against further disruptions.
By March 2026, prices had pulled back more than 22% from the February 2025 peak — but remained historically elevated. The Coffee Barometer 2026 made a pointed observation: “High prices rarely translate into lasting improvements for coffee farmers since farmgate prices tend to rise more slowly than retail prices, then fall more sharply when markets turn. Producers absorb volatility, while traders, roasters and retailers remain better positioned to capture consistent margins.” The farmers who grew the coffee that became globally scarce saw some price improvement — but captured only a fraction of the value that moved through the chain above them.
Who Are the Smallholder Farmers Behind 80% of World Coffee?
The FAO confirmed in its March 2025 primary report that smallholder farmers account for 80% of global coffee production. Most of these farmers operate plots of less than a hectare — smaller than a football pitch — growing coffee as their primary cash crop alongside subsistence food crops. In Ethiopia, coffee export earnings accounted for 33.8% of the country’s total merchandise exports in 2023. In Burundi, 22.6%. In Uganda, 15.4%. For these countries, coffee is not just a commodity — it is a national economic lifeline.
The structural vulnerability of smallholders is acute. They have no ability to hedge prices on commodity futures markets. They depend on intermediary traders to reach exporters. They face rising input costs (fertiliser, labour, water) that commodity prices do not always compensate for. They are on the front line of climate change — with less irrigation infrastructure, less access to weather data, and less ability to relocate to higher altitude if temperatures rise.
The specialty coffee movement — Fairtrade (578,000+ metric tonnes certified), Rainforest Alliance (1.7 million tonnes), and direct trade — has improved conditions for some smallholders. But these certified volumes represent a minority of global production. Most of the world’s coffee still moves through conventional commodity chains where the farmer’s share of the final retail price is small and unstable.
What Is the EU Deforestation Regulation — and How Will It Change Coffee Trade?
The EU Deforestation Regulation (EUDR), adopted in June 2023, requires that any coffee (along with cocoa, soy, palm oil, rubber, cattle, and wood) sold in the European Union must be certified as deforestation-free — meaning it was grown on land not cleared of forest after December 31, 2020. Companies must submit due diligence statements with geolocation data for their supply chains.
The regulation has been delayed twice. It was originally due to apply on December 30, 2024. It was first pushed to December 30, 2025 and then, under Regulation (EU) 2025/2650 adopted in December 2025, pushed again to December 30, 2026 for large operators and June 30, 2027 for micro and small operators. The delays reflect genuine implementation challenges: the EU’s IT system for submitting compliance data was not ready, and smaller operators in producing countries lacked the infrastructure to meet geolocation requirements.
For coffee-producing countries, the EUDR creates significant compliance costs and supply chain restructuring. Vietnam, Brazil, Indonesia, and Ethiopia are among the largest coffee exporters to the EU and will need farm-level traceability systems. For the EU itself, the regulation is designed to ensure that Europe’s consumption habits do not drive deforestation in tropical countries — a legitimate goal given that coffee farming has been linked to forest clearance in several key regions.
Where Is Coffee Consumption Growing Fastest?
The US, Brazil, and Germany consume the most coffee by volume — but the growth story is in Asia. China’s branded coffee shop count grew 58% in 2023 alone to nearly 50,000 outlets, according to the European Coffee Report 2024 citing industry data. Luckin Coffee — a domestic Chinese chain — opened over 5,000 stores in a single year. Japan consumes more than 2 billion cans of ready-to-drink coffee annually through its network of 5 million vending machines. The Asia-Pacific region is now the fastest-growing coffee market in the world.
Meanwhile, per-capita consumption remains dominated by Nordic countries. Finland consumes approximately 12 kilograms of coffee per person per year — the highest in the world, according to ICO data. Norway, Iceland, Denmark, and Sweden follow. In these societies, coffee is not just a beverage — it is a social institution. Sweden’s concept of “fika” — a deliberate mid-morning break with coffee and pastry — is embedded in workplace culture. The cultural embeddedness of coffee in these societies means consumption is relatively inelastic even as prices rise. In the US, 66% of adults drink coffee daily — the highest share in 20 years, according to the National Coffee Association.
- FAO — “Adverse climatic conditions drive coffee prices to highest level in years” (March 2025 · primary · directly fetched · 80% smallholders · $200B industry · $25B trade · 38.8% price rise · Ethiopia/Burundi/Uganda export shares)
- USDA FAS — World Markets and Trade: Coffee (December 2025 · production forecasts · 2025/26 global outlook · 178.8 million bag forecast · ending stocks 5th consecutive decline)
- Wikipedia — “List of countries by coffee production” (citing FAO FAOSTAT 2023 · world production 11.1 Mt · Brazil 30.8% · Vietnam 17.7% · Indonesia 6.8%)
- Daily Coffee News — “Inside the 2026 Coffee Barometer” (July 2026 · Feb 2025 peak $4.40/lb · ICO I-CIP 354.52 c/lb · March 2026 273.70 c/lb · farmgate volatility finding)
- Visual Capitalist — “Visualizing Global Coffee Production in 2024” (February 2025 · citing USDA · Brazil 38% · top 10 = 89% · Bean Belt explained)
- EU Council — “Deforestation: Council signs off targeted revision” (December 2025 · EUDR delayed to 30 December 2026 · Regulation EU 2025/2650)
- ICO — Coffee Report and Outlook (December 2023 · world production 168.2 million bags 2022/23 · Arabica/Robusta split · regional breakdown)
- European Coffee Federation — European Coffee Report 2023/2024 (Germany largest EU importer · China branded shops +58% to 49,691 in 2023 · Luckin/Cotti store counts)
- Economy Insights — “Coffee Consumption by Country” (citing ICO/USDA/ReportLinker 2023 · US ~28 Mb · Brazil ~24 Mb · Germany #3 globally)
What is the global coffee supply chain? The global coffee supply chain runs from ~50 million smallholder farmers in the tropics to 2.25 billion cups consumed daily. Brazil produces 38% of world supply, Vietnam 17%. The industry generates over $200 billion in annual revenues. In 2024, coffee prices rose 38.8% — driven by climate shocks in Brazil and Vietnam. Sources: FAO (2025) · USDA FAS · ICO.












